International Comparisons
FRCan We Really Compare Roadworthiness Test Rates Across Countries?
Published 2 September 2026 · 7 min read
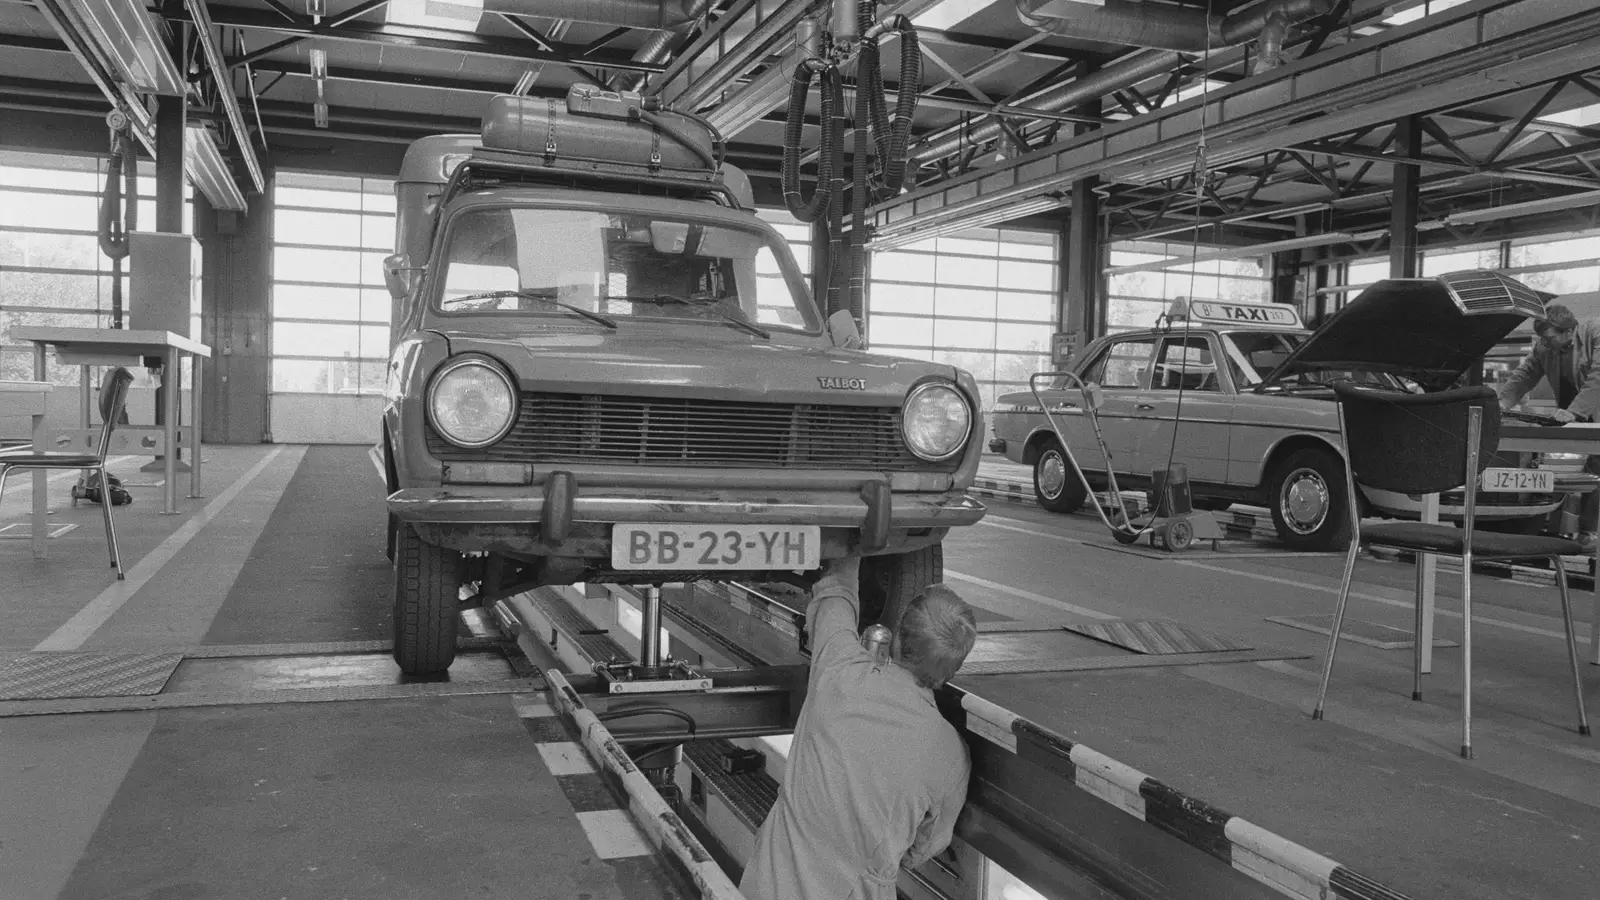
In our France / UK / Netherlands comparison (in French), we showed that a Renault Clio V ranks below the national average in France but above it in the UK. A figure like that raises a question that’s often brushed aside in this kind of comparison: do the UTAC-OTC (France), DVSA MOT (UK) and RDW APK (Netherlands) rates actually measure the same thing? Not quite — and the Dutch case is the clearest example: the RDW failure rate isn’t a published result, it’s an inferred one (more on that below). Here’s what a close look at the rules behind each of the three systems reveals.
Why they can’t be compared as-is
A different age for the first inspection
None of the three countries tests new vehicles the same way:
| Country | Age of the first mandatory inspection |
|---|---|
| France | 4 years |
| UK | 3 years |
| Netherlands | 4 years (petrol, electric) — 3 years (diesel) |
This isn’t a theoretical detail — the actual volumes confirm it. In the “0-3 years” age band, the UK national dataset shows only 1.62 million tests, against 4.99 million for the next band (“3-5 years”) — a ratio of 1 to 3. On the Dutch side, the gap is even wider: 47,819 tests in “0-3 years” against 1.08 million in “3-5 years”, a ratio of 1 to 23. In both cases, almost no vehicle under 3 years old has been tested yet — the few tests that do show up in that band are edge cases (Dutch diesels tested from age 3, imported used vehicles, early tests). Comparing a “0-3 years” rate from one country to another would mean comparing a near-empty sample to a meaningful one.
A different inspection frequency
Once the first test is done, the pace changes too:
| Country | Frequency after the first test |
|---|---|
| France | Every 2 years |
| UK | Every year |
| Netherlands | Every 2 years until age 8, then every year (petrol, electric) — every year from the first test (diesel) |
Concretely, over an age band shown as “5-8 years”: a UK vehicle has been tested up to 3 or 4 times in that window (one test per year), a French vehicle only once (test every 2 years), a Dutch vehicle between 1 and 3 times depending on fuel type. So the displayed rate isn’t the probability of failing “at a given visit” in all three countries — it’s a rate aggregated over a different number of testing occasions per country, for the same age band.
Checked-item categories that don’t line up
The three countries also don’t detect faults at the same level of detail:
- France: 6 aggregated categories (braking, steering/suspension, emissions/engine, lighting/electrical, steering, visibility and other) — the coarsest of the three.
- UK: 44 detailed themes in the DVSA data (about fifteen of them motorcycle-specific, not relevant here), including categories with no direct French equivalent — for example “Speedometer and speed limiter”, “Noise, emissions and leaks” or “Non-component advisories”.
- Netherlands: no published categorisation at all. The RDW provides a raw defect label, but no theme or severity field — this applies to the entire official Dutch defect catalogue.
An item checked in fine detail in the UK can therefore be folded into a broad category in France, or simply invisible in the Netherlands.
Netherlands: an inferred result, not a measured one
This is the most structural difference of the four. The RDW doesn’t publish a result field per test — unlike France (official UTAC-OTC result) and the UK (official DVSA result, coded Pass/Fail/PRS). The Dutch failure rate is deduced: a test is treated as a failure if a defect exists for the same vehicle, dated within ±1 day of the test date. This method was manually validated on a sample of 150 vehicles and 723 defects before being applied at full scale, with a 100% exact match at day 0 on that sample — so it isn’t a haphazard approximation, but it remains an indirect estimate, not a direct measurement of the pass/fail result the way France or the UK provide.
What can be compared, though
None of these differences make international comparison pointless — they just mark out its proper use. A model-by-model comparison (the same vehicle, several markets) stays meaningful when it’s made with these caveats spelled out explicitly: the closest possible matching of age bands between datasets, a systematic reminder of what the Dutch rate actually is (inferred, all generations combined), and reading gaps relative to each country’s national average rather than as absolute values — that’s exactly the approach taken in our Clio V / 3008 II / Clio IV comparison (in French). What these figures don’t let you do, on the other hand, is name a country where a given car is “better built” than in another: the gaps observed could just as easily come from the testing rules themselves as from the vehicle.
Source data: UTAC-OTC (France), DVSA MOT (UK, Open Government Licence v3.0), RDW (Netherlands, CC0 licence). Full detail of each country’s testing rules on the methodology page (in French).
— Also worth reading
International Comparisons
Which Car Brand Has the Best APK Pass Rate in the Netherlands?
A brand league table for the Dutch roadworthiness test (APK), built from the RDW's official open data — 84 brands, 1,384 models, close to 12 million tests.
31 August 2026 · 5 min read
International Comparisons
Which Car Brand Has the Best MOT Pass Rate?
A brand league table for the MOT test, built from the DVSA's official open data — 757 model generations tracked, 29 brands, close to 30 million tests.
28 August 2026 · 5 min read
International Comparisons
Car Reliability: Do France, the UK and the Netherlands Agree?
Can the same car be reliable in France and risky in the UK? What cross-referencing three official roadworthiness-test data sources reveals.
22 August 2026 · 6 min read