International Comparisons
FRWhich Car Brand Has the Best APK Pass Rate in the Netherlands?
Published 31 August 2026 · 5 min read
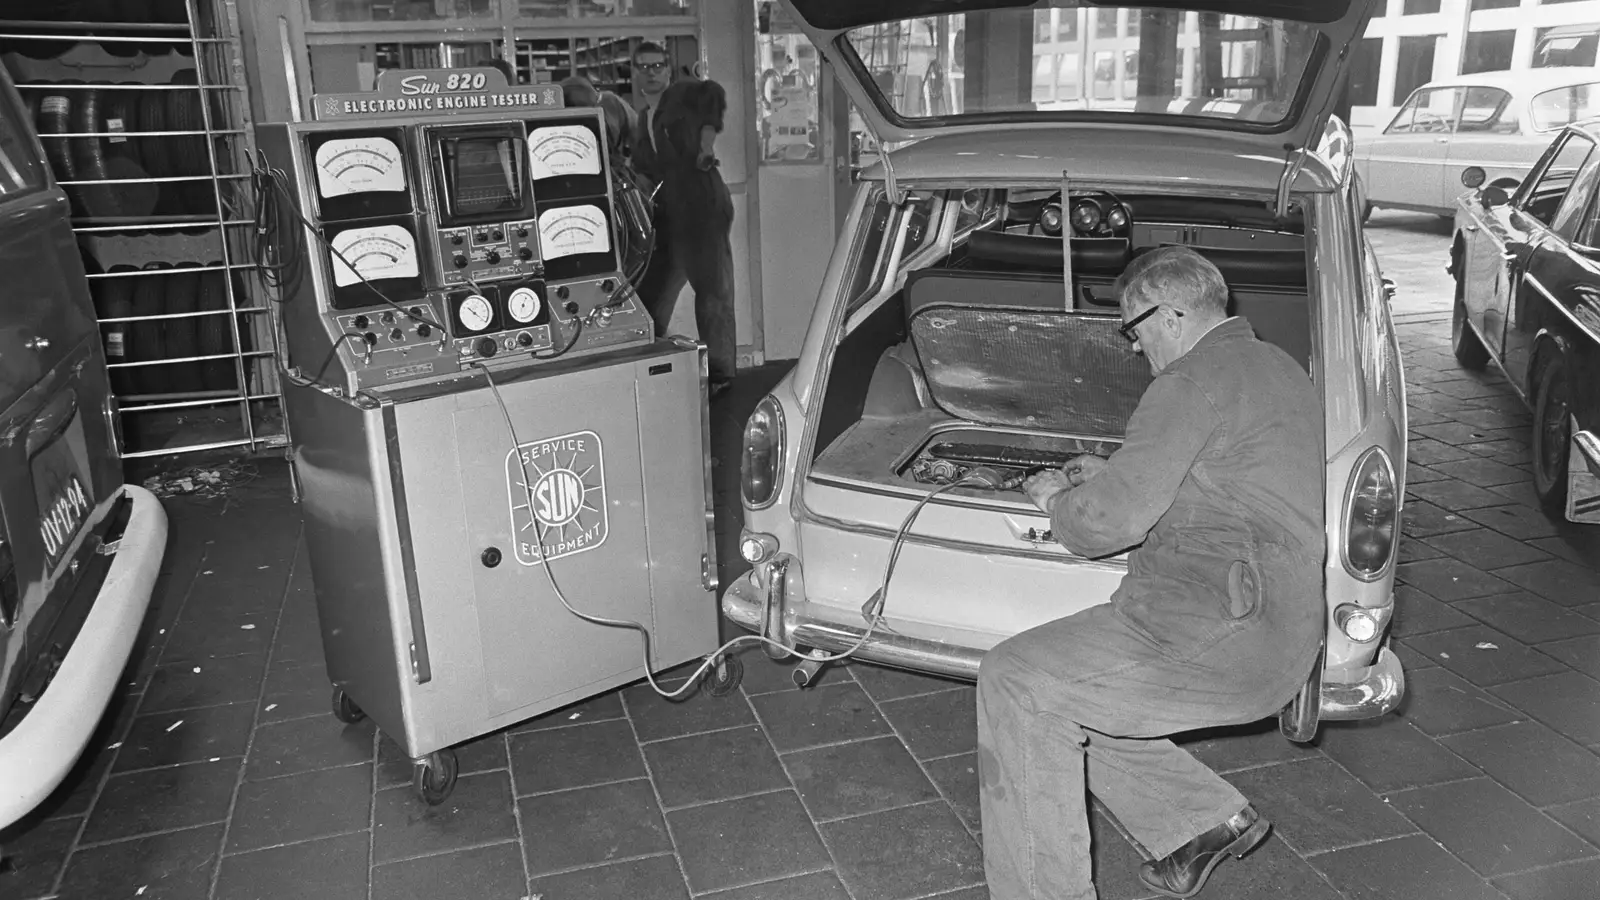
The APK (Algemene Periodieke Keuring) is the Dutch equivalent of the roadworthiness test — the contrôle technique in France, the MOT in the UK — and it is compulsory every year in the Netherlands. The RDW (Rijksdienst voor het Wegverkeer, the Dutch vehicle agency) publishes its data as open data. Here is what it shows, brand by brand. This is the Dutch counterpart to our brand league tables already published for France (in the 2025 Barometer) and for the UK (in the MOT article).
The brand league table
For each brand, we work out an average failure rate, weighted by test volume, across every model we track (using each model’s most-tested age band), after re-merging the labels the RDW wrongly splits — “VW” and “VOLKSWAGEN”, for instance, refer to the same cars. The Netherlands section of the site (in French) tracks 1,384 models and 84 brands, close to 12 million APK tests.
The raw league table for those 84 brands isn’t usable as it stands: the top is filled with motorhome builders (Westfalia, Weinsberg, Adria, Knaus…), which cover few miles and so fail rarely, and with supercar marques on just a few hundred tests each (Ferrari, Aston Martin, Bentley). The bottom is filled with defunct brands running an ageing fleet (Saab, Chevrolet, Daihatsu, Lancia, Rover). Keeping only the mainstream and premium brands still on sale, with a meaningful sample, here are the top and bottom of the table:
| Rank | Brand | Models tracked | Tests analysed | Average failure rate |
|---|---|---|---|---|
| 1 | Lexus | 16 | 35,000 | 28.7% |
| 2 | Škoda | 14 | 282,600 | 31.8% |
| 3 | Audi | 82 | 447,900 | 34.4% |
| 4 | BMW | 162 | 457,500 | 35.5% |
| 5 | Kia | 18 | 502,800 | 36.5% |
| … | ||||
| National APK rate | 37.5% | |||
| … | ||||
| −3 | Citroën | 38 | 508,900 | 43.8% |
| −2 | Honda | 23 | 107,100 | 44.0% |
| −1 | Fiat | 32 | 447,300 | 45.6% |
The national APK failure rate, across all makes and all ages, sits at around 37.5% — that’s the benchmark to keep in mind. The top five brands land below it, the bottom three well above: at a comparable age, a Fiat on Dutch roads is about 1.6 times as likely to fail as a Lexus. Alfa Romeo (43.8%, on 52,000 tests) is level with Citroën; Volkswagen, the most-tested brand in the country with 1.5 million tests, sits just above the average at 39.9%.
One brand actually beats everyone: Cupra, at 18.2%. But we track only 7 of its models and fewer than 6,000 tests, on an entirely recent fleet — too few, and too young, to place in the table alongside carmakers weighing hundreds of thousands of tests.
Two methodological points that matter
Unlike the French and British data used elsewhere on this site, the Dutch data has two features that change how the table should be read:
- It is aggregated across all generations of a model: the RDW does not natively distinguish generations in its public data. A “Golf” in the Netherlands means every Golf of every era still on the road, mixed together.
- The pass/fail result is not published directly by the RDW: it is inferred. We cross-reference test events with recorded defects, and a test with no dated defect attached to it is counted as a pass. That is an inference, not an explicit pass/fail verdict as in the UK.
The full detail of this method is on the methodology page (in French).
What the table doesn’t tell you
Lexus leads, but on the shakiest sample in the table. With 35,000 tests, the brand weighs more than ten times less than Škoda and forty times less than Volkswagen. The Dutch Lexus fleet is also young, lightly driven and carefully maintained: all of which pull the failure rate down without saying much about underlying mechanical robustness. The genuinely solid leading group is Škoda / Audi / BMW / Kia — hundreds of thousands of tests apiece.
Fleet age matters. The rate we use is that of each model’s most-tested age band. Since the APK failure rate climbs from 23% before 5 years to nearly 48% beyond 15 years, a brand with a generally old Dutch fleet looks less reliable partly for that reason, regardless of how the cars were engineered.
The APK is not France’s roadworthiness test. The national APK failure rate (~37.5%) is far higher than the equivalent figure for France’s roadworthiness test (~19%): that gap comes mostly from what each country counts as a failure and from the inference method described above, not from French cars being mechanically better. Comparing the two league tables item for item therefore calls for caution — and sometimes produces opposite results. Citroën, the fourth most reliable high-volume brand in France, ends up second from bottom in the Dutch table. Our international comparison breaks these divergences down model by model, and the British league table applies the same method to the MOT data.
Digging into the detail by model
The site has a full page for every model tracked in the Netherlands, with the failure rate by age band and the most common defects, at /pays-bas/ (in French). The full league table (in French) gives all 84 brands and the most and least reliable models.
Source data: RDW (Rijksdienst voor het Wegverkeer, Netherlands), CC0 licence. Full methodology on the methodology page (in French).
— Also worth reading
International Comparisons
Can We Really Compare Roadworthiness Test Rates Across Countries?
France, the UK, the Netherlands: three roadworthiness-test systems with different rules. What those differences change in how a comparison should be read, and what remains genuinely comparable.
2 September 2026 · 7 min read
International Comparisons
Which Car Brand Has the Best MOT Pass Rate?
A brand league table for the MOT test, built from the DVSA's official open data — 757 model generations tracked, 29 brands, close to 30 million tests.
28 August 2026 · 5 min read
International Comparisons
Car Reliability: Do France, the UK and the Netherlands Agree?
Can the same car be reliable in France and risky in the UK? What cross-referencing three official roadworthiness-test data sources reveals.
22 August 2026 · 6 min read