International Comparisons
FRWhich Car Brand Has the Best MOT Pass Rate?
Published 28 August 2026 · 5 min read
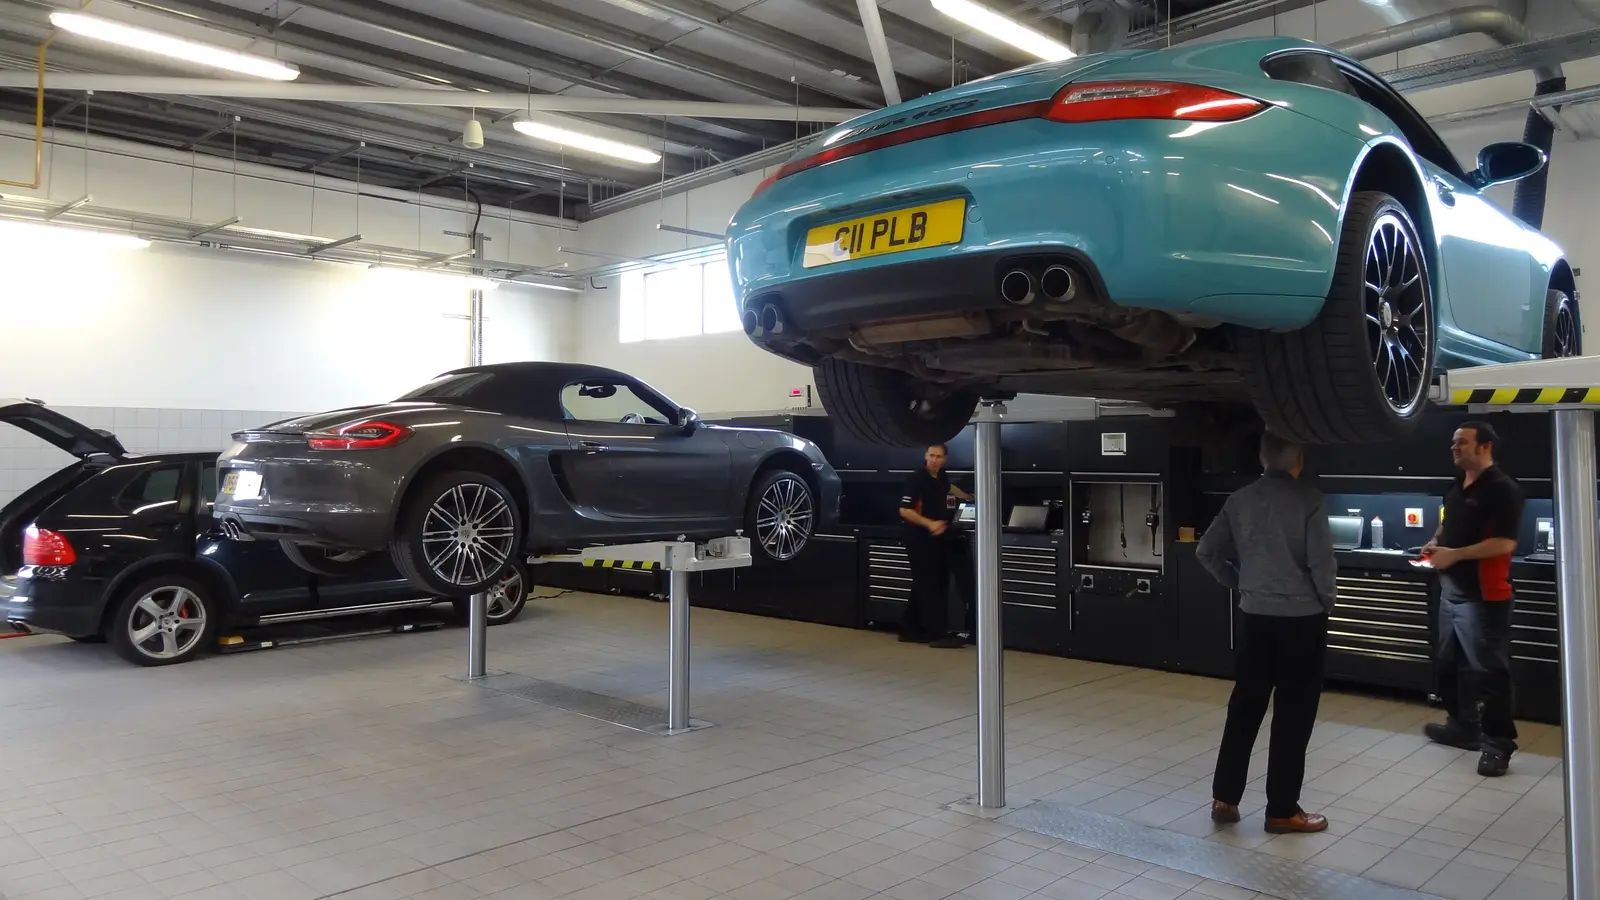
The DVSA (Driver and Vehicle Standards Agency) publishes every MOT result as open data — tens of millions of individual tests, each with the make and model recorded. Aggregate those results by manufacturer and you get a brand league table. Here is what it shows, and what it doesn’t.
The brand league table
For each brand, we work out an average failure rate, weighted by test volume, across every generation we track (using each generation’s most-tested age band). Across the 29 brands and 757 generations in the site’s UK section (in French), here are the top and bottom of the table:
| Rank | Brand | Generations | Tests analysed | Average failure rate |
|---|---|---|---|---|
| 1 | Porsche | 7 | 47,700 | 13.8% |
| 2 | BMW | 90 | 1,680,000 | 22.5% |
| 3 | Jaguar | 12 | 300,000 | 22.8% |
| 4 | Audi | 27 | 1,548,000 | 23.1% |
| 5 | Mercedes-Benz | 48 | 1,722,000 | 24.2% |
| … | ||||
| 25 | Peugeot | 28 | 1,368,000 | 36.2% |
| 26 | Citroën | 23 | 969,000 | 38.9% |
| 29 | Renault | 29 | 980,000 | 41.0% |
The national MOT failure rate, across all makes and all ages, sits at around 30% — that’s the benchmark to keep in mind. The top five brands land well below it, the bottom three well above: at a comparable age, a Renault on UK roads is nearly twice as likely to fail as an Audi.
Two brands that actually finish last don’t appear in that table: Saab (39.7%) and Iveco (39.3%). Saab hasn’t built a car since 2011 and we track only two of its generations; Iveco makes nothing but commercial vehicles. With samples that thin and use cases that specific, ranking them against mainstream brands would mean little — the meaningful bottom three is Renault, Citroën and Peugeot.
What the table doesn’t tell you
Porsche leads, but on the shakiest figure in the table. With just 47,700 tests, it has by far the smallest sample here — thirty times fewer than BMW or Mercedes. The UK Porsche fleet is also young, lightly driven and carefully maintained: all of which pull the failure rate down without saying much about the brand’s underlying mechanical robustness. The BMW / Jaguar / Audi / Mercedes cluster, by contrast, rests on hundreds of thousands to more than a million tests apiece — that’s the genuinely solid leading group.
The MOT data mixes cars and motorcycles. The DVSA publishes every test in a single dataset, with no split by vehicle category. For most brands that changes nothing. But Suzuki (38 of its 63 tracked “generations” are motorcycles — Hayabusa, Bandit, GSX-R, V-Strom…) and Honda (29 of 59 — CBR, VFR, Pan-European…) come out flattered: two-wheelers fail the MOT far less often than cars. Keep only the car models and Suzuki moves from roughly 26.5% to 28% and drops several places, Honda from 29.2% to a little over 30%. The top and bottom of the table don’t move.
Fleet age matters. The rate we use is the average of each generation’s most-tested age band. A brand with an old UK fleet — Renault is one — looks less reliable partly for that reason, regardless of how the cars were engineered.
A different yardstick from France’s roadworthiness test
The MOT and France’s roadworthiness test (UTAC-OTC) don’t use the same methodology or the same list of checked items. The national MOT failure rate (~30%) is in fact much higher than the equivalent figure for France’s roadworthiness test (~19%) — a gap that comes mostly from what each country counts as a failure, not from French cars being mechanically better. Comparing a French brand ranking with a British one item for item therefore calls for caution, and sometimes produces opposite results. Mazda, the fourth most reliable brand in France, drops to 20th in the UK; Honda makes the reverse journey. Our international comparison breaks these divergences down model by model.
Digging into the detail by generation
The site has a full page for every generation tracked in the UK, with the failure rate by age band and the most common defects by category, at /royaume-uni/ (in French). The MOT league table (in French) gives the full ranking of all 29 brands, along with the most and least reliable generations.
Source data: DVSA MOT testing data (UK), Open Government Licence v3.0. Full methodology on the methodology page (in French).
— Also worth reading
International Comparisons
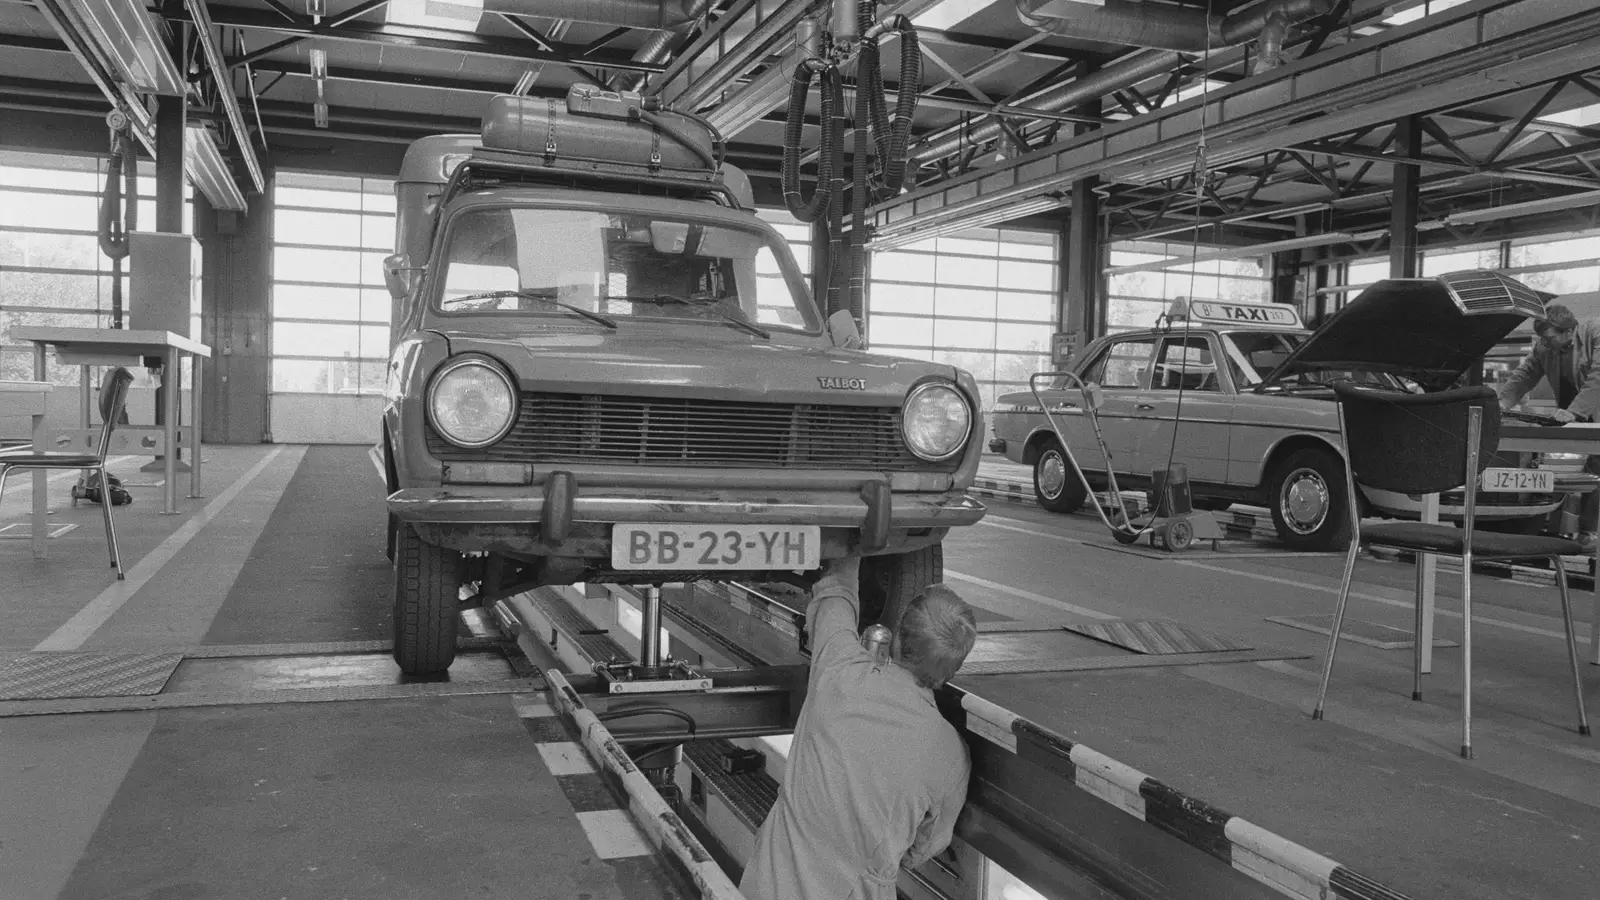
Can We Really Compare Roadworthiness Test Rates Across Countries?
France, the UK, the Netherlands: three roadworthiness-test systems with different rules. What those differences change in how a comparison should be read, and what remains genuinely comparable.
2 September 2026 · 7 min read
International Comparisons
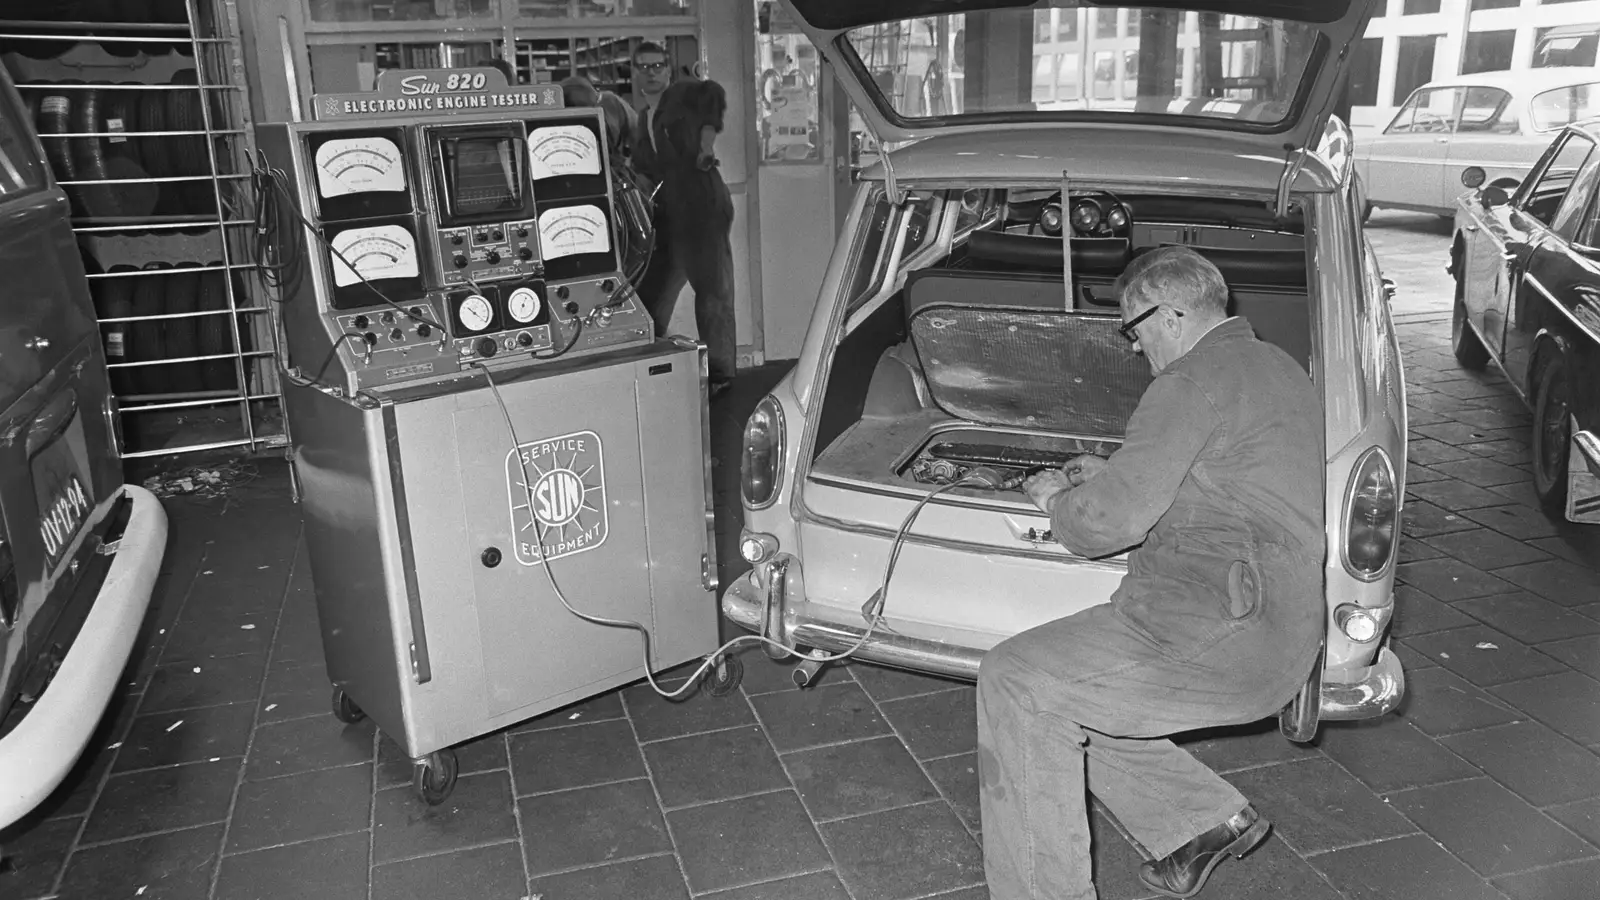
Which Car Brand Has the Best APK Pass Rate in the Netherlands?
A brand league table for the Dutch roadworthiness test (APK), built from the RDW's official open data — 84 brands, 1,384 models, close to 12 million tests.
31 August 2026 · 5 min read
International Comparisons
Car Reliability: Do France, the UK and the Netherlands Agree?
Can the same car be reliable in France and risky in the UK? What cross-referencing three official roadworthiness-test data sources reveals.
22 August 2026 · 6 min read