Barometers & Studies
FRThe 2025 Barometer of Car Reliability in France
Published 18 August 2026 · 6 min read
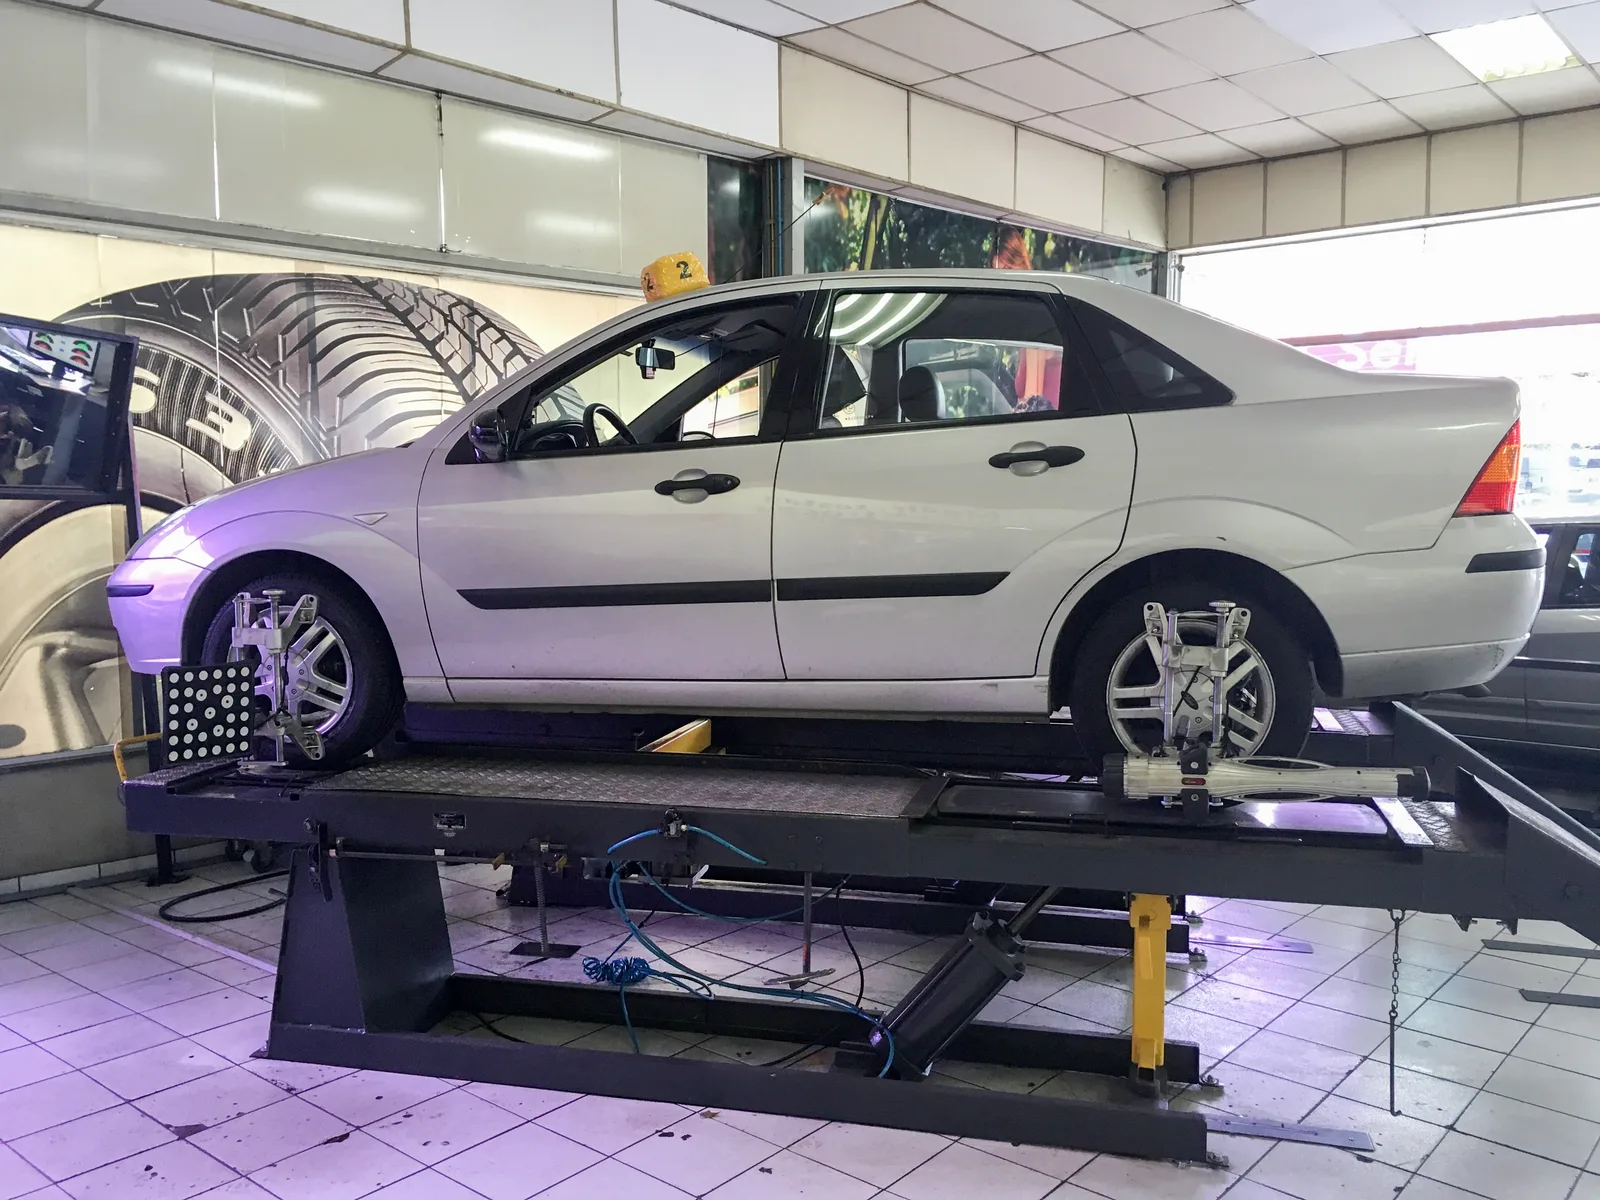
Every year, millions of roadworthiness tests (the French contrôle technique — broadly equivalent to the UK’s MOT) are carried out across France. This data, published by UTAC-OTC, says something precise about how vehicles actually hold up over time — provided you know how to read it correctly. Here’s what the 2025 edition reveals.
The key figures
- 530 models tracked, covering 96.2% of the real national testing volume.
- 38 brands represented, from single-model niche manufacturers to mass-market volume.
- 18.94%: the average retest rate recorded this year, across all models.
This isn’t an abstract percentage: it’s the share of vehicles that, once presented for testing, have to come back for a second visit after repairs. The lower this rate for a given model, the better that model holds up, over time, on the points actually checked (braking, suspension & steering, emissions, lighting).
The 2025 podium
Three models stand well clear of the rest of the fleet:
- Škoda Fabia I — 1.32% retest rate
- Toyota Yaris I — 2%
- Mercedes M-Class I — 2.2%
At the other end of the table, two models stand out for the wrong reasons:
- Fiat Punto II — 43.71%
- Alfa Romeo 159 / Brera / Spider III — 42.73%
The gap between the top and bottom of this ranking is considerable: more than 42 percentage points separate the Škoda Fabia I from the Fiat Punto II.
Brand rankings: beware of samples that are too small
The ranking of the 38 brands is more of a lesson in methodology than a scoop. At the top of the raw table: Alpine (6.99%), Chrysler (8.2%), Cupra (10.58%). Impressive figures — but each one rests on a single tracked model. A sample size of one doesn’t support any serious generalisation about a whole brand’s reliability.
Excluding brands with too small a sample (fewer than 5 models tracked), the podium changes completely:
- Mazda — 13.81% (11 models tracked)
- Hyundai — 14.86% (17 models)
- Land Rover — 16.76% (8 models)
Conversely, looking at high-volume brands (more than 25 models tracked, so the most representative of the real fleet):
| Brand | Average rate | Models tracked |
|---|---|---|
| Audi | 17.76% | 27 |
| Mercedes | 18.48% | 32 |
| BMW | 18.55% | 32 |
| Citroën | 19.16% | 38 |
| Toyota | 20.92% | 28 |
| Ford | 23.17% | 28 |
| Volkswagen | 23.44% | 32 |
| Renault | 24.91% | 40 |
| Peugeot | 25.55% | 36 |
| Opel | 26.42% | 25 |
This is the table that actually makes statistical sense — not the raw ranking topped by brands with a single model.
What this barometer doesn’t tell you
The roadworthiness test assesses safety (braking, suspension & steering, emissions, lighting), not a vehicle’s overall mechanical reliability (internal engine wear, clutch, gearbox). A low retest rate signals good durability on the points actually checked — a solid statistical signal, but a partial one. The full methodology, its limitations, and how it compares with the UK and Dutch data also available on this site, are explained on the methodology page (in French).
See the full detail
The full ranking of all 530 models, filterable by category and brand, is available on the rankings page (in French). To compare two models side by side, the comparison tool (in French) shows retest rate, national rank and supporting data at a glance.
Source data: UTAC-OTC, French roadworthiness test (contrôle technique), 2025. Full methodology available here (in French).
— Also worth reading
Barometers & Studies
Dacia: Is a Budget Car Less Reliable? What the Roadworthiness Test Shows
Sandero, Duster, Logan... What does France's official UTAC-OTC data say about Dacia? Retest rates by model, comparison and recalls.
16 October 2026 · 6 min read
Barometers & Studies
Toyota: Does Its Reliability Reputation Hold Up at the Roadworthiness Test?
What does France's official UTAC-OTC data say about Toyota? Retest rates by model, comparison with other brands, and recalls.
10 October 2026 · 6 min read
Barometers & Studies
Lancia: What Do the APK and Roadworthiness Test Data Show?
A rare sight in France these days, Lancia is still on the road in the Netherlands. APK pass rates and French data, model by model.
4 October 2026 · 4 min read