Practical Guides
FRWLTP Fuel Consumption Figures: How to Read Them Before You Buy
Published 23 August 2026 · 3 min read
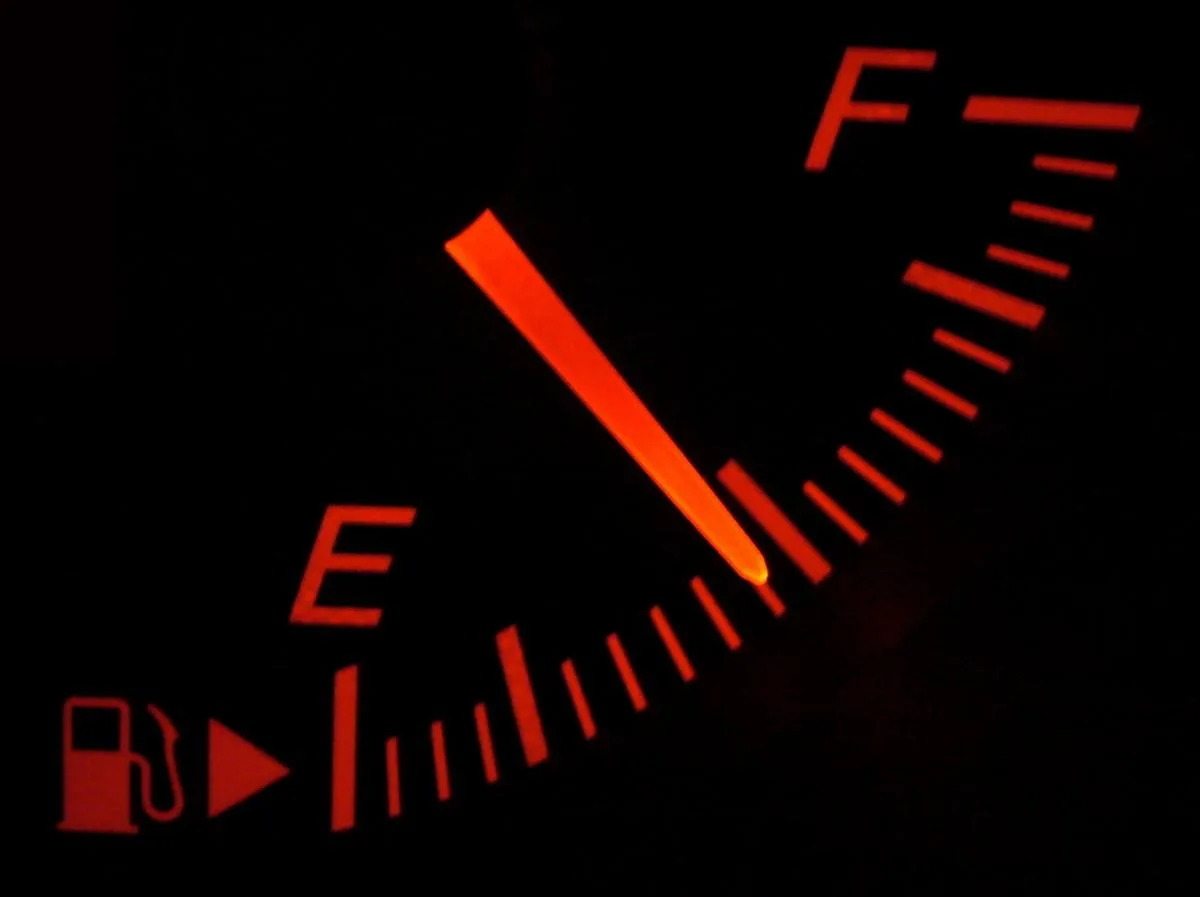
The consumption figure printed on a spec sheet is almost never the one you’ll see day to day. That’s not the manufacturer getting it wrong — it’s simply how the WLTP test cycle works: it measures consumption under standardised conditions, not in your actual driving. Here’s what to understand before relying on a single number to budget for fuel.
What WLTP actually measures
WLTP (Worldwide Harmonized Light Vehicles Test Procedure) replaced the older NEDC cycle in 2018 to give a more representative measure of new vehicles’ fuel consumption and CO₂ emissions. The protocol was tightened compared with NEDC — a longer test cycle, sharper acceleration, higher average and top speeds. But it remains a laboratory bench test, run at a fixed temperature, driving style and vehicle load — conditions that never perfectly match a real journey (air conditioning, traffic, winter driving, each driver’s own style).
The gap with reality
A European Commission report, based on on-board (OBD) fuel-consumption data from over 600,000 vehicles, found real-world consumption running about 18-24% above the official figure for petrol and diesel cars. For plug-in hybrids, the gap is far wider — several times the official figure — which is why some sites, including this one, don’t calculate an estimated fuel cost for that powertrain. By contrast, track tests run by the Touring Club Suisse (TCS) under conditions close to the official protocol found a much narrower gap: it’s mainly real-world driving — traffic, weather, individual style — that widens the gap, not the test protocol itself.
On this site
The consumption figures shown on this site’s model pages come from ADEME Car Labelling — they are official WLTP figures, not real-world measurements. They currently cover 88 vehicle families still sold new. A few examples:
| Model | Powertrain | WLTP consumption | Estimated fuel cost/year* |
|---|---|---|---|
| Peugeot 308 II (French page) | Petrol & Diesel | 4.2-6.3 L/100km | €1,407 |
| Peugeot 208 II (French page) | Petrol & Diesel | 3.8-5.9 L/100km | €1,309 |
| Peugeot 208 II (French page) | Electric | 15-17.3 kWh/100km | €604 |
| Renault Clio V (French page) | Petrol & Diesel | 4.1-7.8 L/100km | €1,604 |
*Based on 15,000 km/year, indicative prices — detail on the methodology page (in French).
To estimate your actual fuel budget rather than just the type-approval figure, add roughly 15-25% for a conventional petrol or diesel car — bearing in mind that motorway driving, winter conditions or dense urban traffic push the gap toward the upper end of that range.
Why it matters for your budget
This site’s budget simulator (in French) and model pages build their estimated fuel cost from these WLTP figures. Keep that margin of error in mind when working out your overall cost of ownership: over 15,000 km a year, a 20% upward adjustment to the fuel budget often adds several hundred euros a year to the figure shown.
Source data: ADEME Car Labelling (WLTP cycle). Full methodology on the methodology page (in French).
— Also worth reading
Practical Guides
Ford: Fiesta, Focus, Kuga... What Does the Roadworthiness Test Show?
What does official UTAC-OTC data say about Ford? Retest rates by model, comparison with other brands, recalls and the view from abroad.
22 October 2026 · 5 min read
Practical Guides
Clio, 208 or C3: Which City Car Does Best at the Roadworthiness Test?
A comparison of France's three best-selling city cars based on official UTAC-OTC data: retest rates, national ranking, recalls and used prices.
19 October 2026 · 6 min read
Practical Guides
Peugeot 307 and 1007: What Does the Roadworthiness Test Show?
Two 2000s Peugeots still much sought after second-hand: retest rates, national ranking and recalls, based on official UTAC-OTC data.
6 October 2026 · 4 min read